
S&P 500 Elliott Wave Analysis of Trump... China, You're Fired!

Wow, what a week!
Trump Tweets and the market goes wild! I don't know, maybe it's time for me to sign up for a Twitter account??? Nah!
Well, the market had a lot of back and forth this week - trapping both longs and shorts. There were some pretty good trading opportunities... Of course, there is usually more opportunity when there is volatility. The VIX has been ranging between 16 and 23. Not explosive volatility but better than when it was hanging around 12.
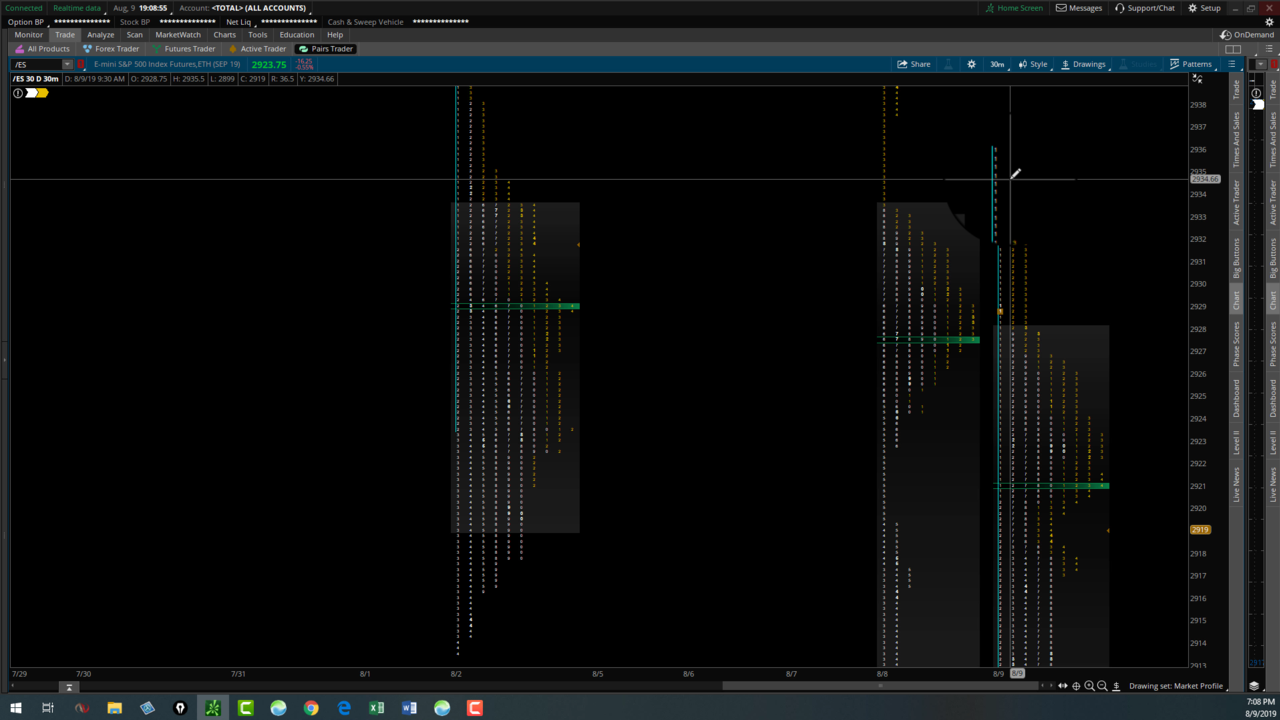
In this week's video I cover Elliott Wave, my bullish count and my bearish count - which one I'm leaning more towards. I also am reviewing the Market Profile Charts and what to watch for on Monday.
S&P 500 and the Inverted Yield Curve - Recession Coming?

New Workbook - https://bit.ly/2Zl105d
Sign up for weekend updates - https://bit.ly/2KuRZSp
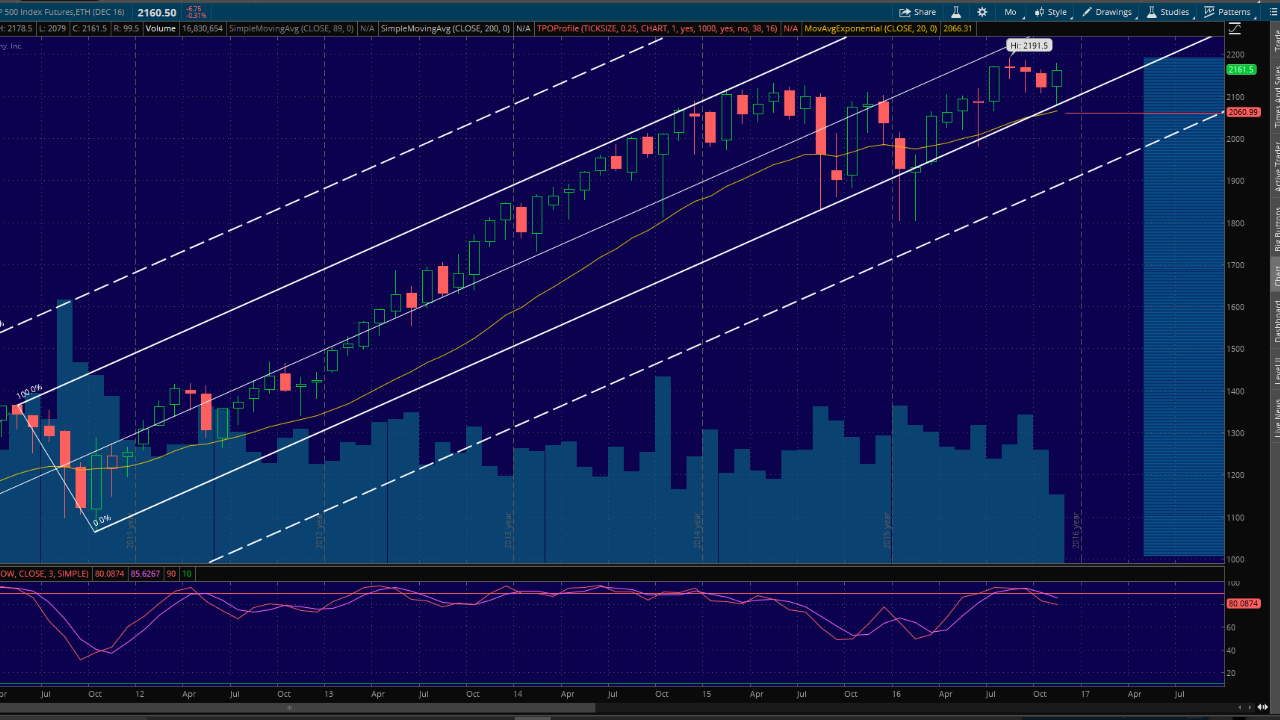
Hi, thanks for checking out my analysis of the S&P 500. This week I'm going to see how the 10 and 3 Year Bond Yield Curve relates to the S and P 500. Are we headed for a Recession or is the Yield Curve a Broken Barometer? (Inverted Yield Curve) Today, I'll be using Elliott Wave Theory as well as Market Geometry to give my an idea of what the market is doing. If you're a day trader, swing trader or scalper I hope that this video on the SPX and ES Emini Futures contract will just give you another way to look at the market. Another point of view. I give two scenarios - One for a Bull Market and one for a Bear Market. Please share if you've find this helpful and leave a comment.
Don't forget to check out my new workbook here - https://bit.ly/2Zl105d
TEST Your Trading System and Knowledge with the Traders Test!
https://bit.ly/2Zb69zT
Thanks for watching!!!
Was the Bull Market Over on July 26, 2019? S&P 500 Update
New Workbook - https://bit.ly/2Zl105d
Sign up for weekend updates - https://bit.ly/2KuRZSp
Hi, thanks for checking out my analysis of the S&P 500. I'm using Elliott Wave Theory as well as Market Geometry to give my an idea of what the market is doing. If you're a day trader, sing trader or scalper I hope that this video on the SPX and ES Emini Futures contract will just give you another way to look at the market. Another point of view. I give two scenarios - One for a Bull Market and one for a Bear Market. Please share if you've find this helpful and leave a comment.
Don't forget to check out my new workbook here - https://bit.ly/2Zl105d
And sign up for weekend updates here - https://bit.ly/2KuRZSp
Thanks for watching!!!
Trading Crude Oil Futures 11-21-16

Hey There! Here's a short video explaining my thoughts on the Crude Oil Futures Market. So if you're either Day Trading or Swing Trading Crude Oil Futures then take a minute and check out my Technical Analysis. Most of these concepts beginners will understand but if you have any questions please leave a comment. These Crude Oil Futures Charts are from my Think or Swim account and I have other videos on how I set them up. For more Trading Tips check out my website. If you have found value in these videos please Like and Share - It's much appreciated. Thank You!
Trading the E Mini S&P 500 Futures 11-21-16

Hey All, Here's a Short Video showing my Technical Analysis of the S&P 500 E Mini. Hope It Helps! - Please Share and Like - Thanks!
S&P 500 Futures Analysis E-Mini 11-14-16
Hi All! Here's my video explaining my views on the S&P 500 Futures Market. So if you're either Day Trading or Swing Trading E-Mini Futures then take a minute and check out my Technical Analysis. Most of these concepts beginners will understand but if you have any questions please leave a comment. These Crude Oil Futures Charts are from my Think or Swim account and I have other videos on how I set them up. For more Trading Tips check out my website. If you have found value in these videos please Like and Share - It's much appreciated. Thank You!
Trading Crude Oil Futures 11-14-16

Hey There! Here's a short video explaining my thoughts on the Crude Oil Futures Market. So if you're either Day Trading or Swing Trading Crude Oil Futures then take a minute and check out my Technical Analysis. Most of these concepts beginners will understand but if you have any questions please leave a comment. These Crude Oil Futures Charts are from my Think or Swim account and I have other videos on how I set them up. For more Trading Tips check out my website. If you have found value in these videos please Like and Share - It's much appreciated. Thank You!
Crude Oil Analysis 11-07-16
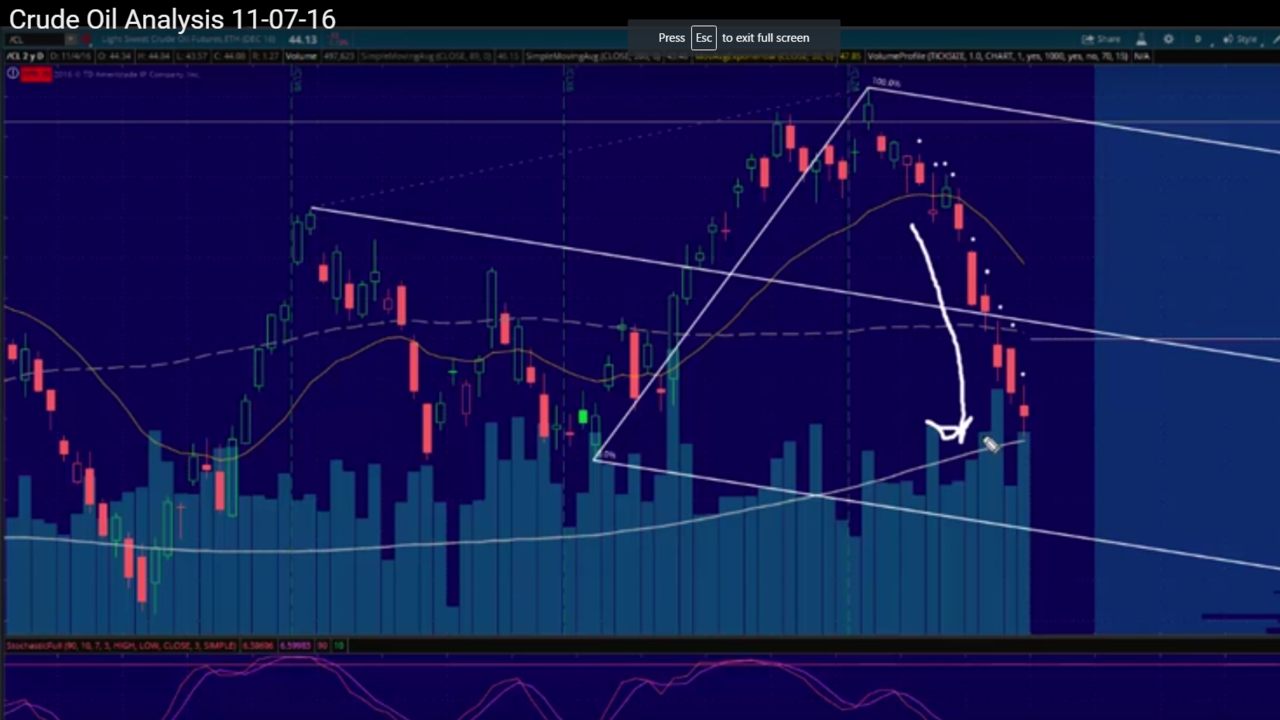
Hey! Here's my Crude Oil Technical Analysis for this Election Week! I'm using Market Profile, Price Action and Market Geometry. Please Like and Share - I really appreciate it!
-PEACE!
S&P 500 Analysis 11-07-16
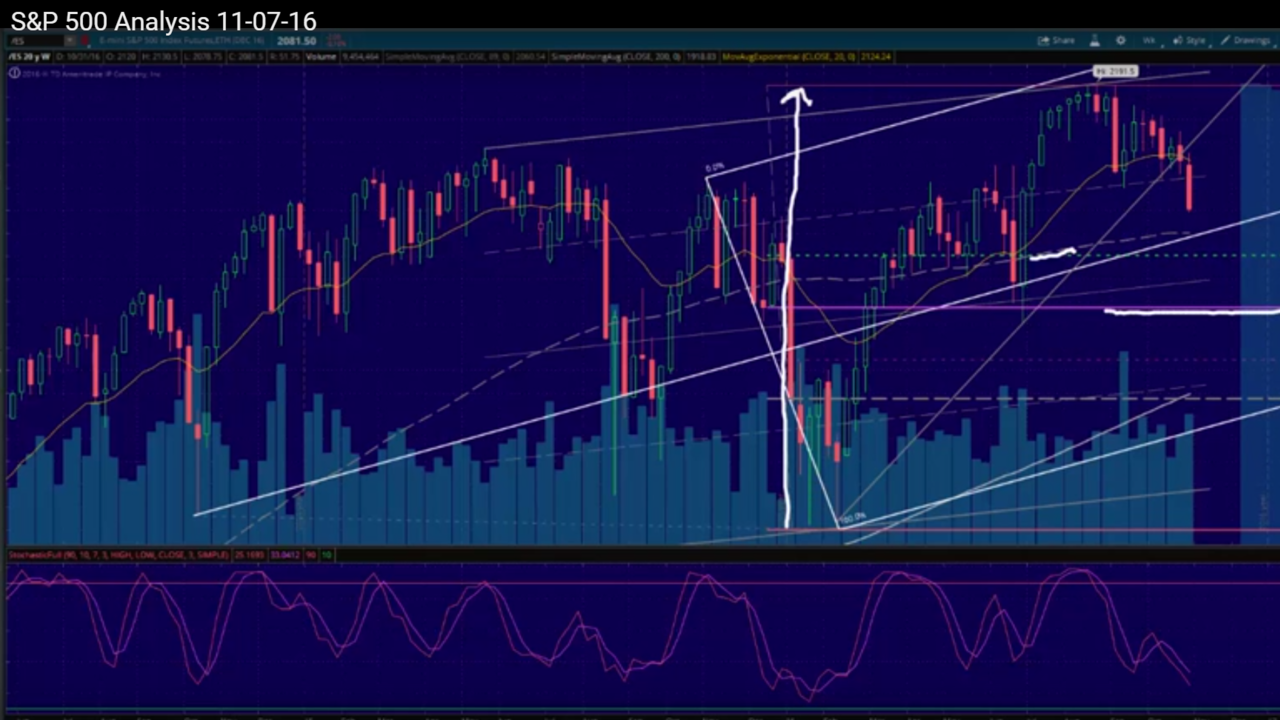
Hey There! Here's my weekly video of the S&P 500 Futures Analysis using Market Profile, Price Action and Market Geometry for Technical Analysis. I hope it serves you - Please Like and Share. Thanks A Lot!!!
Crude Oil Futures Analysis 10-31-16
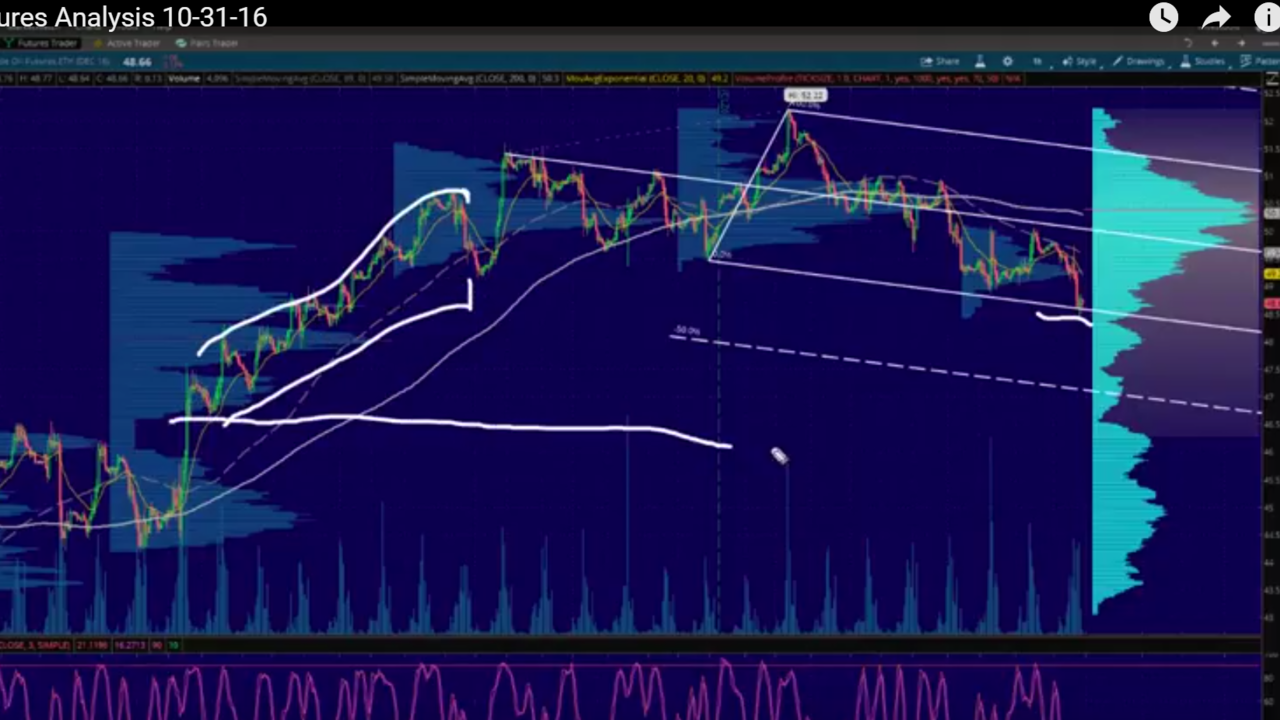
Hi, Here's my analysis of the Crude Oil Futures Market - Technical analysis using Price Action, Market Profile and Market Geometry. I really appreciate the Shares and Likes - Let me know if you have any questions. Thanks!
